Dashboard
The Dashboard is the first thing you see when you open a workspace. It gives you a high-level overview of your project's status and key metrics.
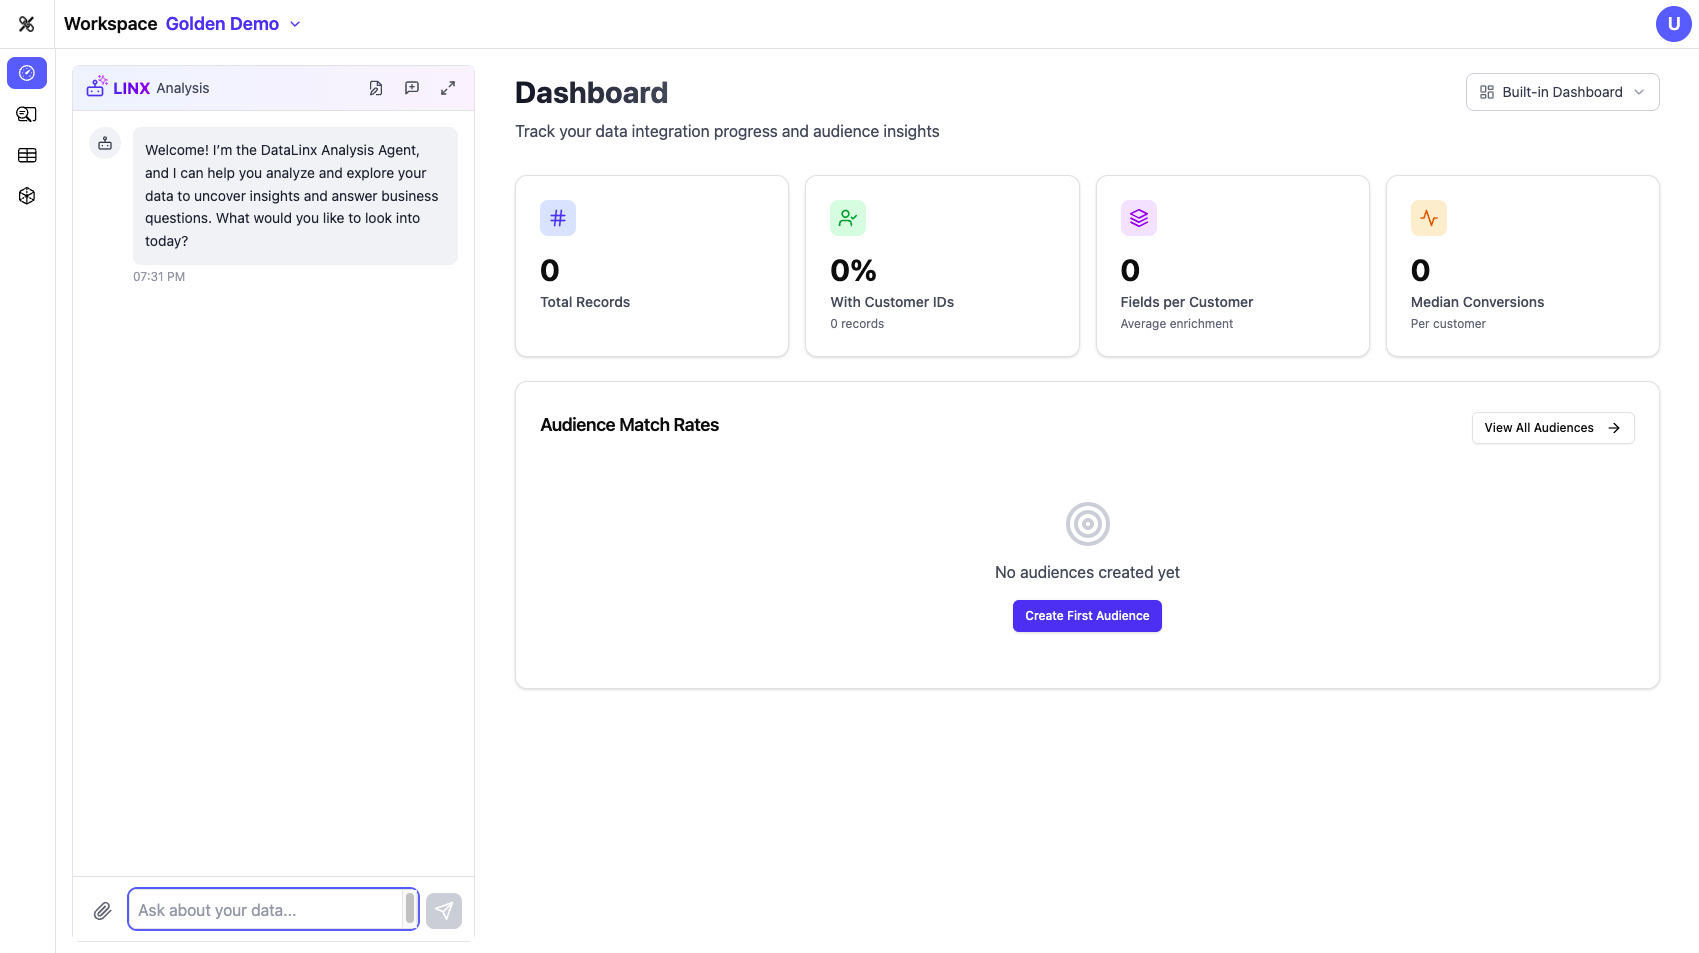
What You'll See
Workspace Stats
At the top of the Dashboard, you'll find summary cards showing:
- Source tables discovered — How many tables Datalinx has found in your connected sources
- Target tables created — How many tables exist in your target schema
- Active mappings — How many field-level mappings are configured
- Data connections — How many source connections are active
- Audiences activated — How many audience segments have been exported
- Mapping errors/ambiguities — Any issues that need attention
These numbers update as you work through the Configure workflow.
Workflow Progress
A visual progress indicator shows where you are in the data pipeline lifecycle:
- Discovery — Have your sources been scanned?
- Mapping — Are your fields mapped to the target?
- Testing — Have your mappings been validated?
- Deployment — Is your pipeline running in production?
This helps you (and your team) quickly see what stage the project is in and what needs to happen next.
Integration Logos
A visual display of supported downstream integrations (Google, Meta, Amazon, TikTok, LinkedIn, etc.), showing which platforms your data can flow to.
Saved Dashboards
Below the overview section, you'll see any dashboards that have been saved in this workspace. Dashboards are custom views built from queries and visualizations — think of them as mini-reports you can create and share.
Creating Dashboards
You can create custom dashboards from the Dashboard tab:
- Click Create Dashboard (or use the Analysis Agent to help)
- Add tiles by writing queries or selecting saved queries
- Choose visualization types for each tile (bar charts, line charts, pie charts, etc.)
- Arrange tiles with drag-and-drop
- Save and name your dashboard
Dashboards can also be accessed via direct links, making them easy to share with teammates.
Using the Analysis Agent
The AI chat panel on the left side of the Dashboard is powered by the Analysis Agent. You can ask it questions like:
- "How many source tables do we have?"
- "What's the status of our mappings?"
- "Create a dashboard showing customer counts by region"
The agent has full context about your workspace and can help you understand your data at a glance.