Configure: Data Sources
The Data Sources tab is your starting point in the Configure workflow. This is where you explore, understand, and manage the raw data coming from your connected databases.
What You'll See
When you open the Data Sources tab, you'll see a schema browser that displays all the tables and columns available in your connected source databases.
Schema Browser
The left side shows a tree structure of your source data, organized by:
Source Connection
  └── Schema
       └── Table
            └── Column (with data type)
You can expand and collapse schemas and tables to browse the structure. Each table shows its columns along with their data types and constraints.
Filtering and Search
With large databases (hundreds or thousands of tables), you can:
- Search for specific table or column names
- Filter by relevance — Datalinx scores each table's relevance to your project, so you can focus on what matters
- Collapse schemas you don't need
Table Actions
When you click on a table, several actions become available:
Data Preview
View a sample of the actual data in the table. This helps you understand what's in each column without writing a query. The preview shows a handful of rows with all columns visible.
Metadata
View and edit metadata about the table:
- System metadata — automatically detected information like row count, column types, and constraints
- Custom metadata — descriptions and notes that you or the AI agent have added
- Column descriptions — human-readable explanations of what each column contains
Metadata has two states:
- Draft — a proposed description (often AI-generated)
- Accepted — a confirmed, reviewed description
Column Metrics
For each table, you can view statistics about individual columns:
- Null count — how many values are missing
- Uniqueness — how many distinct values exist
- Data distribution — patterns in the data
These metrics help you assess data quality before you start mapping.
Lineage
View the upstream and downstream dependencies of a table — where data flows from and where it flows to. The lineage diagram shows:
- Which source tables feed into which targets
- Column-level lineage (which source column maps to which target column)
- Any intermediate transformations
Discovery: Letting the AI Scan Your Sources
One of the most powerful features in the Data Sources tab is Discovery — an AI-driven process that automatically analyzes your source tables.
How Discovery Works
- You (or the Pipeline Agent) trigger a discovery scan
- The AI scans every table in your selected schemas
- For each table, it generates:
- A relevance score (0-100) indicating how useful the table is for your project
- A table description explaining what the table contains
- Column descriptions for every column
- A rationale explaining why the table is or isn't relevant
Relevance Scoring
Tables are scored based on their content:
| Score Range | Meaning | Examples |
|---|---|---|
| 95-100 | Core entity tables | Customer master, user accounts |
| 85-94 | Transaction/behavioral tables | Orders, events, purchases |
| 70-84 | Campaign/measurement tables | Ad impressions, conversions |
| 55-69 | Enrichment tables | Demographics, preferences |
| 40-54 | Partial overlap | Some useful columns |
| 0-39 | Low relevance | System tables, logs |
Examine (Per-Schema Discovery)
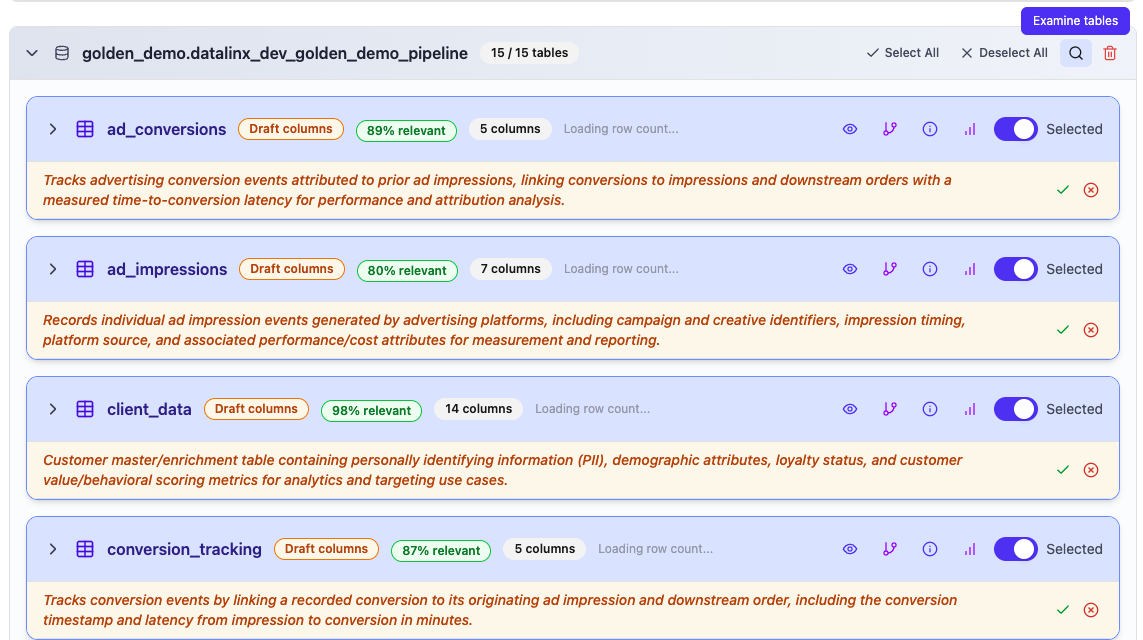
Next to each schema in the schema browser, you'll see a magnifying glass icon — this is the Examine button. Clicking it triggers an AI-powered discovery scan on that specific schema.
When you click Examine:
- The AI analyzes each table in the schema one by one
- As each table is processed, the results appear in real-time — you'll see descriptions, relevance scores, and column metadata populate as the scan progresses
- A status message at the top shows which table is currently being analyzed
- When complete, all tables in that schema have AI-generated descriptions and relevance scores
You can stop an in-progress examination by clicking the spinner — this cancels the scan while keeping any results that were already generated.
Examine is the recommended way to run discovery because it lets you scan one schema at a time, which is useful when your source database has many schemas and you only want to analyze specific ones.
Running Discovery via the Agent
You can also trigger discovery conversationally by asking the Pipeline Agent:
- "Discover my source tables"
- "Examine the analytics schema"
- "Scan all tables in the raw_data schema"
Discovery runs in the background and updates the Data Sources tab progressively as it analyzes each table.
Adding New Schemas
If your source database has additional schemas you want to explore, you can add them through the Add Schema dialog. This connects to the source and pulls in the schema metadata for browsing and discovery.
Tips
- Run Discovery early — it gives you and the AI agent a much better understanding of what data is available
- Review the AI-generated descriptions and correct any that are wrong. Accurate metadata makes everything downstream (mapping, insights, agents) work better.
- Pay attention to the relevance scores — they help you prioritize which tables to map first
- Use the lineage view after setting up mappings to verify data is flowing correctly