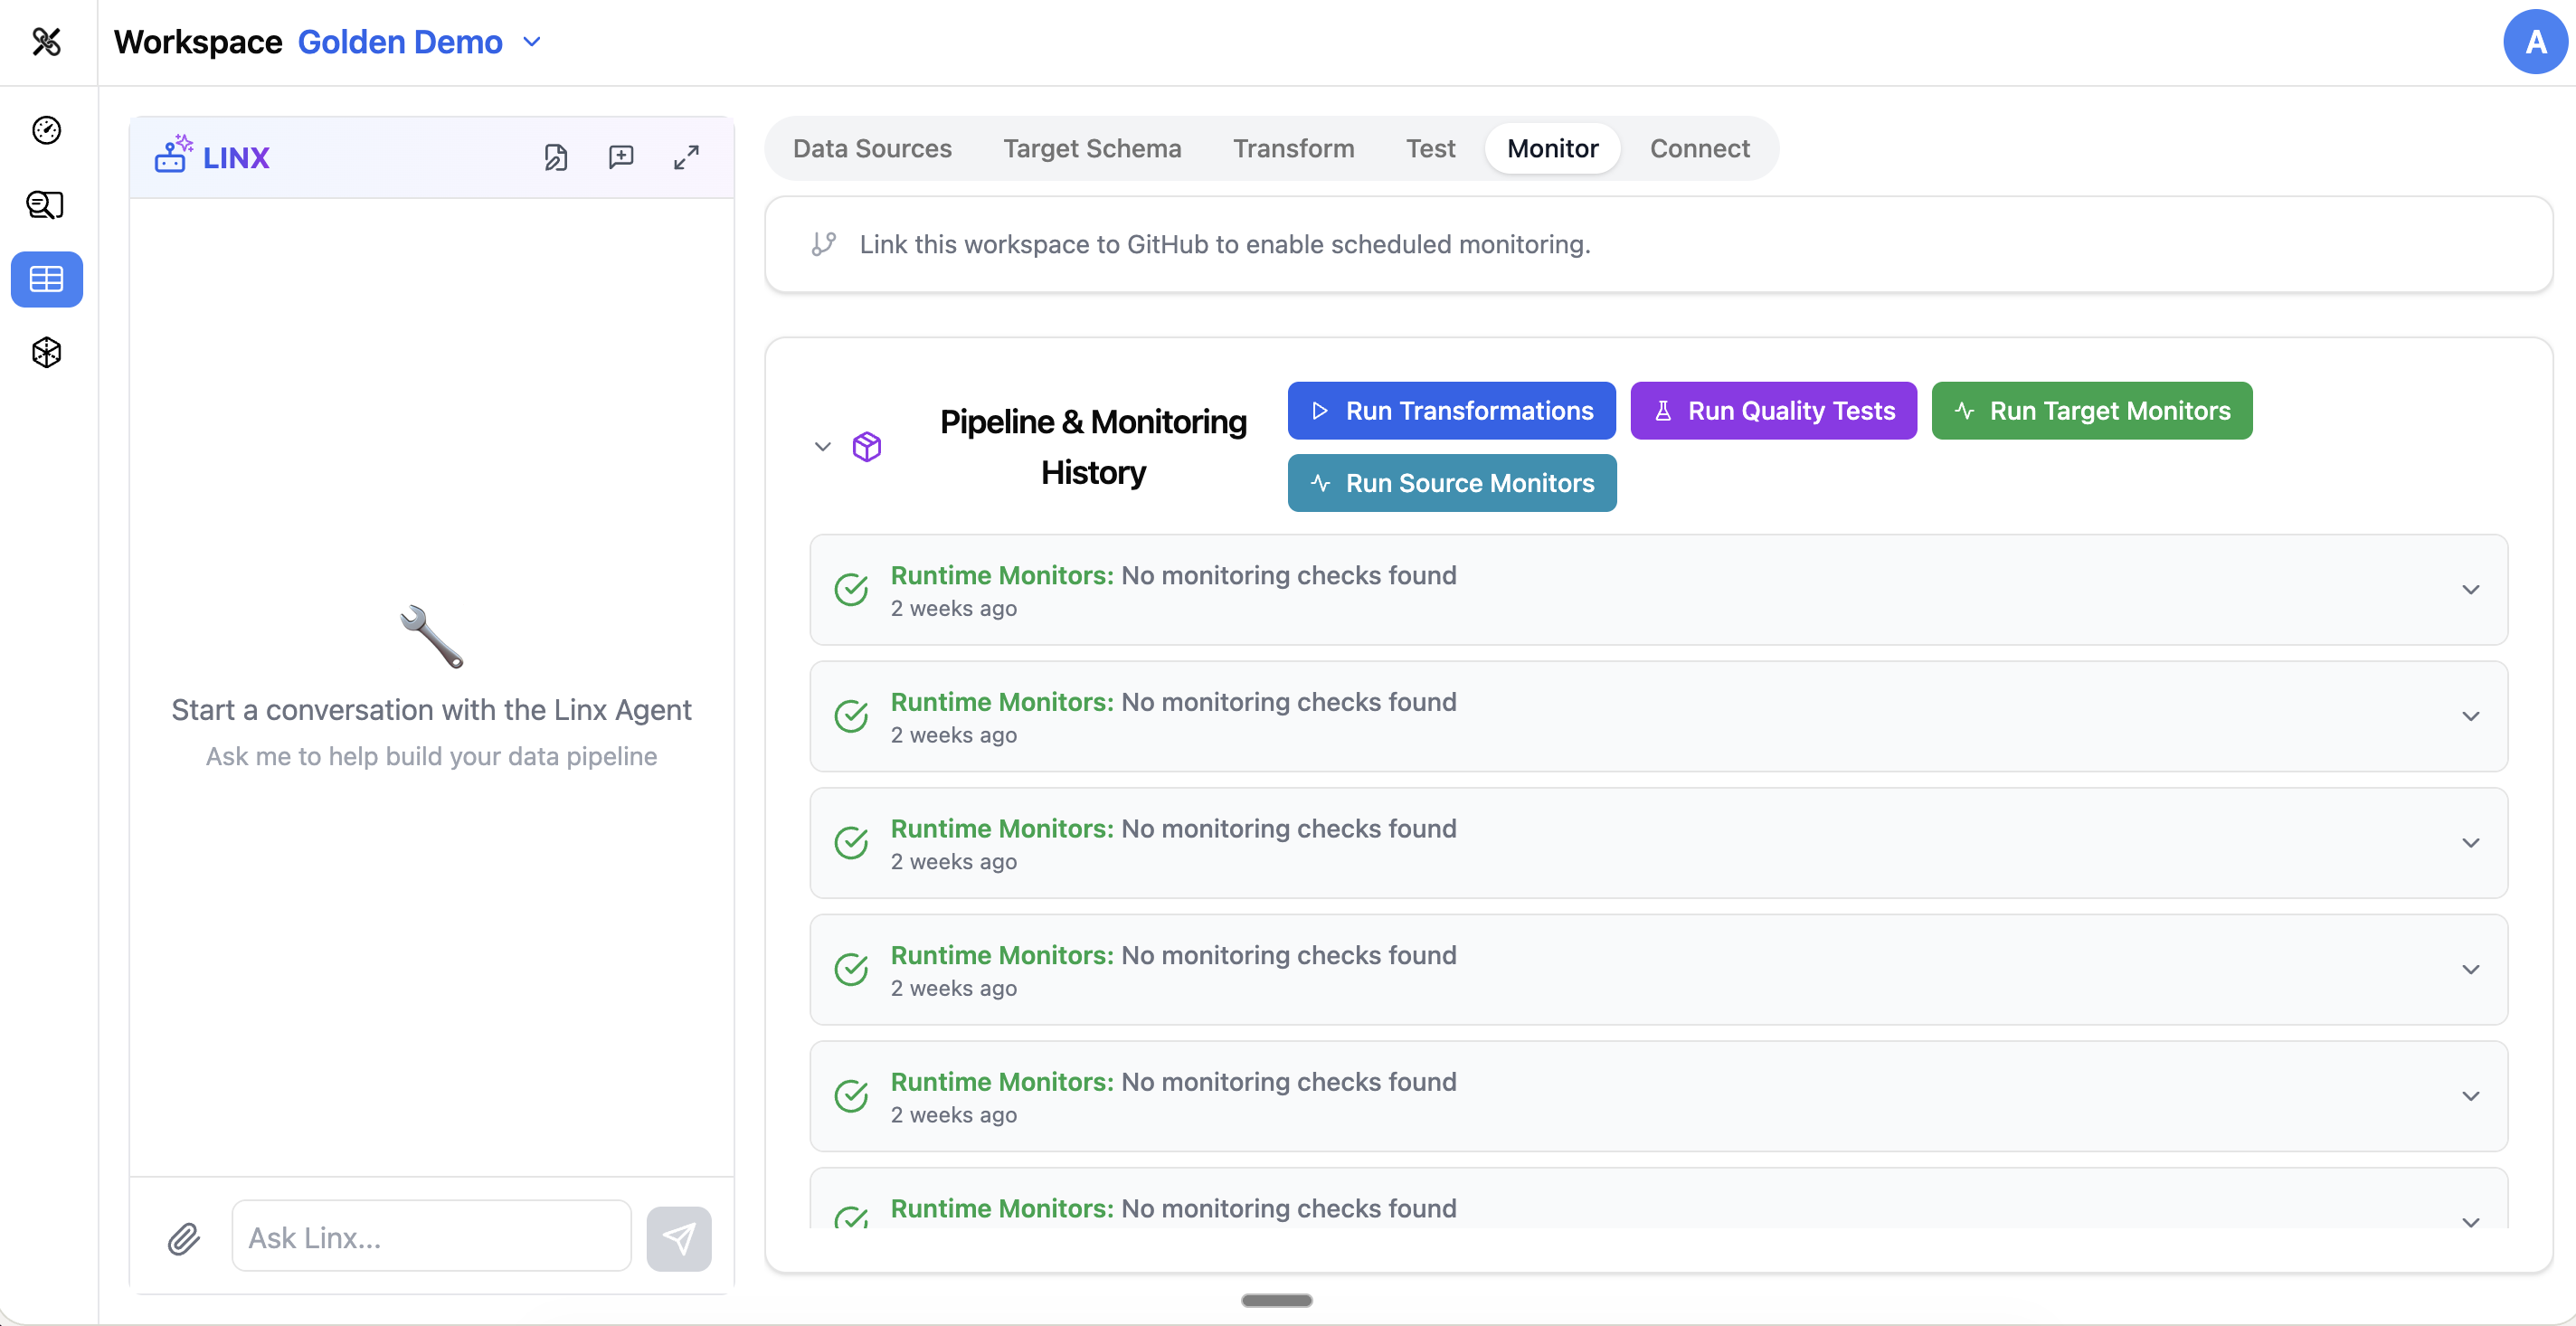
Configure: Monitor
The Monitor tab is your ongoing data quality command center. Once your pipeline is running, this is where you track data health, set up alerts, and manage scheduled jobs.
Data Quality Metrics
The Monitor tab tracks several dimensions of data quality across your target tables:
| Metric | What It Measures |
|---|---|
| Completeness | Are all expected fields populated? How many nulls exist? |
| Uniqueness | Are key fields actually unique? Are there duplicates? |
| Consistency | Does the data follow expected patterns across tables? |
| Accuracy | Are values within expected ranges and formats? |
| Validity | Do values conform to defined rules (e.g., valid emails, dates in range)? |
| Timeliness | Is data arriving on schedule? Is it fresh? |
| Relevance | Is the data still aligned with business needs? |
| Integrity | Are referential relationships maintained (e.g., every order has a valid customer)? |
Quality Thresholds
Each metric is graded against thresholds:
- Excellent — data quality is strong, no action needed
- Good — minor issues that should be monitored
- Fair — some issues that should be investigated
These thresholds can be customized per table or column based on your requirements.
Quality Score Cards
Each monitored table has a quality score card showing:
- Overall quality score
- Breakdown by metric dimension
- Trend over time (is quality improving or degrading?)
- Specific columns that need attention
Column-Level Monitoring
You can configure monitoring at the individual column level:
- Select which columns to monitor
- Choose which quality metrics apply to each column
- Set custom thresholds for specific columns
- View historical trends for each monitored column
Alerts
Set up alerts to be notified when data quality drops:
- Threshold alerts — trigger when a metric falls below a defined threshold
- Drift alerts — trigger when data patterns change significantly
- Pipeline failure alerts — trigger when a scheduled job fails
When alerts fire, they appear as a notification bubble in the navigation, so you can see at a glance if something needs attention.
Scheduled Jobs
The Monitor tab also lets you manage your pipeline execution schedule:
- View all scheduled jobs and their status
- See the history of past runs (success, failure, duration)
- Manually trigger a pipeline run
- Adjust scheduling frequency
Test Results History
Previous test results are accessible from the Monitor tab, giving you a longitudinal view of data quality over time. This is especially useful for:
- Identifying gradual quality degradation
- Verifying that fixes actually resolved issues
- Building confidence in your pipeline before expanding it
Using the Pipeline Agent
The Pipeline Agent can help with monitoring:
- "What's the current quality score for the customers table?"
- "Are there any failing tests?"
- "Set up an alert if the orders table has more than 5% null values in customer_id"
- "When was the last successful pipeline run?"
- "Show me the monitoring trends for the past week"
Tips
- Configure monitoring early, even before your pipeline is in production — it gives you a baseline to compare against
- Focus monitoring on your most critical columns first (primary keys, email addresses, amounts)
- Set realistic thresholds — not every column needs to be 100% complete
- Review alerts regularly and adjust thresholds if you're getting too many false positives
- Use the trend view to spot gradual issues that might not trigger individual alerts